Crypto XLNC Academy · Katana Series · 7 November 2026 · Sim Khela
Levels of the Levels
The floor snaps.
The floor is snapping: the first close is through it, and the rule on this page waits for a second. As we were building this page the chip makers, the engine of the whole AI trade, fell through the zone I drew under them: SMH 447.73 (close, 5 Nov), −11.2% on the day, straight through my pivot zone of 490 to 510. The stock market's fear gauge, the VIX, jumped from 16.61 at the 4 November close to 28.18 (close, 5 Nov). And Japan went through its floor: the Nikkei futures at 57,060 (close, 5 Nov). Bonds broke first, in September and October. Now the AI trade is breaking. Breaks like this take time to travel, and in my read the tumble builds through the end of the year, the market holds up just long enough for the Anthropic IPO to raise its money, and then the real tumble of the whole sector begins in 2027. This page shows you how pressure builds at a level, why it snaps, who is forced to sell and who is forced to buy when it does, and why we, in cash, are the calmest people in the room.
My read, not personal advice. Educational only.
Closes to 5 Nov 2026
Price has a memory
Then the floor snaps
Price has a memory. Watch where it comes back to.
- Price has a memory
- Then the floor snaps
A comet of light that is price falls onto a dark plane and bounces. Where it lands the plane of a floor appears in light, brighter each time. Then the floor snaps: a hairline of gold parts, motes pour through the seam, and the price sinks quietly below.
Six days since the excuse
Then the chips snapped
Six days. Oil fell off a cliff, gold fell through its floor and came back to knock on it, Seoul lost five percent in a day, Bitcoin is fighting for eighty thousand, and on 5 November the chip makers broke through their floor.
- Six days since the excuse
- Then the chips snapped
Eight small charts of the last seven weeks, each with its change since the 30 October close: Bitcoin −1.4%; Gold +5.3%; WTI −12.5%; US 10-year −2.0%; USD/IDR +0.2%; MOVE −2.3%; KOSPI −14.3%; Semis (SMH) −14.3%.
18 of 23
BROKEN, TESTING OR BREAKING A CRITICAL ZONE
Almost everything is on its line
And now the floor snaps
Almost every market on earth is standing on its line at the same time, and some have already broken.
- Almost everything is on its line
- And now the floor snaps
The board: 23 markets in seven tiers, each with its zone and its latest price. 18 of 23 are broken, testing or (on a partial print) breaking a critical zone.
If you only read one screen
A level is not a line, it is a zone: a band of prices where orders wait. Every touch spends them, and when the last ones give, everyone forced to sell, or forced to buy back, moves at once. That is a snap. Bonds broke first, in September and October. On 5 November the AI trade broke: the chip makers fell through my pivot zone, the VIX jumped through its calm line, and Japan went through its floor in the futures. We are in a high-volatility season. In bonds, oil and crypto it has run for weeks; in stocks it has just begun. In a season like this, spikes like 5 November are normal. 18 of 23 markets on my board are broken, testing or breaking a critical zone at the same time, and with patience they break hard, or they already have. My read on how long: breaks travel, the tumble builds through year end, markets hold up just long enough for the Anthropic IPO to raise its money, and the sector's real tumble begins in 2027. We are in cash, and the panic, not our nerves, decides when we catch.
IThe level
How to see a level
The market has a memory, and it remembers because we do.
Before I show you a single market, I want you to see what I see. A level is a price the market remembers. It held once, so people expect it to hold again. Because they expect it, they put their money there. And because their money is there, it holds. Until it doesn't. And when it breaks, everyone who was standing on it is suddenly standing under it.
The market is one mind, and a level is a thought it keeps coming back to. Learn to see those thoughts, and the noise goes quiet. Hold on to that picture. Next you'll see what happens inside a level when it gives way, and then you'll watch it happen live: in bonds, in the chips, in Japan.
A floor buyers keep defending
Broken floors become ceilings
A floor is a price buyers keep defending, and the day it breaks, the same price turns into a ceiling.
- A floor buyers keep defending
- Broken floors become ceilings
Seen from below, the broken floor now hangs as a ceiling of gold light with a healed hairline, warm motes gathered on its underside, and price, coming back up, is turned away under it. Far above, the old glass ceiling is a faint ghost.
Price hits a zone
Not a pixel
Thousands of people draw the line a little differently, so price turns somewhere inside a band, never at one exact number.
- Price hits a zone
- Not a pixel
The Nifty 50 daily from April 2025, drawn as a line of light. Sim's line at 21,964.60 widens into a gold zone from 21,960 to 22,200. Lows in April and October 2026 land inside the band at different prices, each one a small bloom. Last 23,961 on 4 Nov 2026.
Each touch spends the zone
How much is left
Every touch spends some of the buyers waiting in a zone, so on a fifth test I ask how much of the floor is left.
- Each touch spends the zone
- How much is left
A floor of light worn into a dip by five touches; each touch dimmer, and only a thin thread of waiting buyers left.
Levels inside levels
The bigger one always wins
Every zone sits inside a bigger one, and when a small zone breaks, the bigger one underneath decides what happens next.
- Levels inside levels
- The bigger one always wins
Seven terraces of gold light stacked from top to bottom, each one shorter and fainter than the one above, labelled in order: fear, plumbing, commodities, currency, stocks, Asia, crypto. The biggest zone sits at the top and outranks everything beneath it.
Everyone remembers the same price
Breakeven is a wall of sellers
Which price lives in you
A level is the crowd's memory. We all remember the same prices, and everyone who bought the top waits there just to get their money back.
- Everyone remembers the same price
- Breakeven is a wall of sellers
- Which price lives in you
A brain made of light turns slowly while a band of price passes through it and turns gold inside. The number 80,000 is written in light on the band. Up high an old top glows with a short queue of lights lined up just under it. Inside the mind, three small lights glow: the prices you remember.
How to read my screen
Each mark tells a story
These are signals, not prophecies. I read them in context, against the zones, never alone.
- How to read my screen
- Each mark tells a story
Gold daily from June 2025 with the Market Cipher A signals recomputed from the open formulas, lit one at a time: a blue triangle on 4 August 2026, a red X on 1 September, the ribbon turning grey on 23 September, a red diamond on 14 October and a yellow X on 30 October at the break of Sim's rising trendline zone.
Go deeper
A floor buyers keep defending is support. A ceiling sellers keep defending is resistance. When a floor breaks and price comes back up to it, it usually turns into a ceiling: the retest. A trendline is the same thing on a slope.
Price hits a zone, not a pixel. Thousands of people each draw the line a little differently, so their orders spread across a band and price turns somewhere inside it. A wick through the zone is a test. A close beyond it, held, is a break. Wider zones belong to bigger timeframes and wilder markets.
Touches make a zone famous, but each touch also spends the orders resting there. A zone hit again and again is wearing thin. Remember that when we get to the small coins.
There are levels inside levels, and the bigger one always wins. A weekly zone outranks a daily one, and a decade-long zone outranks them all. The more often a zone has been tested and the more famous its price, the more money waits there. And a zone in bond fear moves everything beneath it, while a zone on a small coin moves only that coin. That is why I always start with fear and bonds, and end with altcoins.
Why does it work? People. The first price you saw becomes your truth. People who bought the top wait to sell at breakeven, so every old high is a crowd of sellers. 80,000 is a story; 79,384 is not. Everyone looks at the same chart, so the zone works because everyone believes it works. And a zone is where the crowd agreed last time. A level is collective memory. The market is one mind, and a level is a thought it keeps coming back to.
How to read my screen
| Mark | What it measures | What I've learned it usually means |
|---|---|---|
| White line / grey line (the ribbon) | EMA 21, white while EMA 11 is above EMA 34, grey when not. | White: the run is alive. Grey: it is resting or over. |
| Blue triangle | EMA 11 crosses above EMA 15. | The trend is shifting. |
| Red X | EMA 5 crosses below EMA 11. | The push is tiring. |
| Red diamond | The WaveTrend wave crosses down. | Momentum has turned. A rhythm, not a verdict. |
| Blood diamond | A red diamond and a red X on the same day. | Both clocks agree. Take it seriously. |
| Yellow X | A red diamond printed while already oversold. | Selling heavier than the market can explain. It often marks manipulation, a forced flush, or someone who needs out at any price. |
| Yellow diamond | Two up candles opening above both trend lines, with no red signal. | Clean strength. |
| Green dot (lower panel) | The wave turns up from oversold. | The sellers are exhausted. |
| Gold zones and lines | Mine. | A thin line is where I drew it; the band around it is where price actually turns. |
| Gold dashes (Bitcoin, Nasdaq) | A previous cycle laid over this one, or my range. | Drawn, not data. Never a price to buy at. |
The zone and verdict rules on this page
| BROKE UP / BROKE DOWN | Two daily closes in a row beyond the zone, in that direction, within the last 30 sessions, after a close inside it or across it. A floor only breaks down, a ceiling only up. | |
|---|---|---|
| TESTING | The latest close is inside the zone, or within one zone-width of it. | |
| HOLDING | Price has bounced from the zone and the latest close is more than one zone-width away. | |
These are signals, not prophecies. Red diamonds print hundreds of times in six years. I read them in context, against the zones, never alone. The zone and verdict rules on this page teach you to read a chart; they are not trading rules. Market Cipher is a TradingView indicator I read; it is not our algorithm. Symbol definitions follow the open-source approximation of the indicator; my version differs slightly.
IIThe snap
Pressure, then the snap
A floor can look strong right up to the moment it snaps.
Here is the physics of what you're about to watch. Pressure builds where the orders sit. Every time price comes back to a floor, it eats some of them. From the outside the floor looks just as strong. Inside, the wall is getting thinner.
Just under the floor waits the fuel: stop losses, borrowed bets that will be closed by force, margin calls. Nobody there chose to sell. They will be forced to. So when the last bids give, they all fire at once. Price doesn't drift through a major level. It snaps through, violently.
The same physics runs upward. Above a ceiling, the people who bet on a fall are forced to buy back. That squeeze is how a fear gauge jumps. So a snap is not a mood. It is mechanics. Forced money has no choice. We do, because we are waiting in cash. Now watch it travel.
Every zone hides orders
Break it and they fire
Just past every zone waits the fuel: stop losses, borrowed bets closed by force, option dealers' hedges. Break the zone and they all fire at once.
- Every zone hides orders
- Break it and they fire
A long gated dam made of old-gold light holds a lake of light. Hairline cracks of gold spread across its face, then the gate section lets go and a flood of gold and ice motes pours downstream into three small reservoirs, labelled stops, liquidations and margin calls, filling each in turn.
Orders stack at a level
Every touch spends them
Then the floor snaps
Forced sellers, forced buyers
Each return eats a layer of the buyers holding the floor. When the last of them give way, everyone forced to sell, or to buy back, moves at once.
- Orders stack at a level
- Every touch spends them
- Then the floor snaps
- Forced sellers, forced buyers
A floor of gold light with a dense wall of small glowing bricks, the buy orders, resting on it. Price, a blue-white point with a soft trail, falls onto the wall and touches it three times; each touch peels a layer of orders away while a pressure gauge fills and three faint green reservoirs light up under the floor: stops, liquidations and margin calls. Then the last orders give, the floor's heart line cracks into dashes and price drops through, igniting each reservoir it passes so the fall accelerates. The frame then splits: on the left the broken floor is a dim ceiling above price and a streak of light points down; on the right the same physics runs in mirror, short sellers forced to buy back driving price up through a ceiling, a streak pointing up.
Who is forced, and how fast
Hours, days, weeks, month end
The slow money comes last
A snap is not one trade. It is a queue of people forced to act, the fast money first, the slow money last. That is why a break takes weeks.
- Who is forced, and how fast
- Hours, days, weeks, month end
- The slow money comes last
A spark of gold light at the top of a vertical thread drops down a ladder of four rungs, each longer and heavier than the last. Hours: stop losses, liquidations and option dealers hedging. Days: margin calls and volatility-targeting funds cutting risk. Weeks: trend-following funds whose signals turn slowly. Month and quarter end: pensions, balanced funds, risk parity and redemptions. A faint note says the same queue runs in reverse for forced buyers such as short sellers buying back.
Go deeper
And the machines, the derivatives. Stop losses sit just under support, and leveraged traders' liquidation prices sit under their entries. A break triggers the stops, the stops push price into the liquidation prices, and those push it further: a cascade. Market makers know where that fuel sits, so a quick wick through a zone and straight back is often the stops being taken before a reversal. Big open interest at an options strike makes the dealers' dealer hedging pin price near it into expiry, and push it faster once it escapes. Trend models all watch the same zones, so a break becomes an event. A futures curve adds time: when the far months reset to a new zone and hold it, the new price is a regime, not a spike.
And margin calls travel. A loss in one market forces selling of whatever can be sold in another. That is how a crack in one place becomes a crack everywhere: the forced seller doesn't choose what to sell, he sells what he can.
Why a snap takes time to play out. The forced money moves on different clocks. In hours: the stops, the liquidations and the option dealers hedging. In days: the margin calls, and the funds that hold a fixed amount of risk and have to cut it as volatility jumps. In weeks: the trend-following funds whose signals turn slowly. At the month and quarter end: the pensions and balanced funds rebalancing. The fast money goes first and the slow money comes last. A floor snapping is the start of a move, not the end of it.
Inside the wall. Buyers stack their bids on a floor because it held before, and each return spends some of them while the pressure builds. And upward: a fear gauge snaps up when the people who sold insurance have to buy it back.
IIIThe wave
Fractures travel
A crack starts in one place, and then it runs.
We have started to witness the first fractures in the system, and they don't arrive everywhere at once. They travel.
Bonds broke first. In September and October the US ten-year, what America pays to borrow for ten years, pushed through its old ceiling, bond fear climbed, and Treasuries had their worst quarter since 1994. Then the fear gauges for oil and Bitcoin broke their calm lines. The hack of Binance at the end of October was a major fracture of its own. And now, on 5 November, the AI trade is fracturing, and countries are starting to tumble: Japan went through its floor.
Why start with bonds? Because almost everything is priced off them. A crack there becomes a wave, and each market feels the wave on its own clock. This page paints that, step by step. And the first thing a crack wakes up is fear.
Breaks travel
Bonds first, then fear
Then the AI trade
Then Seoul, Tokyo and crypto
SEPOCTLATE OCT4 TO 5 NOV5 NOV
The dataThe crack showed in Seoul hours before New York
Bonds went first, then fear, then the AI trade, from Seoul and Tokyo to New York and into crypto: one wave, each market feeling it on its own clock.
- Breaks travel
- Bonds first, then fear
- Then the AI trade
- Then Seoul, Tokyo and crypto
A stylised dotted world map in old gold light. Markets ignite in time order and arcs of light travel between them: New York bonds first (the ten-year, then MOVE), then the oil and Bitcoin fear gauges, then the hack in crypto, which is drawn as a card of its own because crypto has no country, with a ring of light around the whole map; then Seoul and Tokyo chips in the Asian session of 4 to 5 November, then New York chips and the VIX, then Japan's futures through the Nikkei floor overnight, and a dotted arc continuing forward to year end. States: 10-year testing, move broke up, oil fear broke up, bitcoin fear broke up, bitcoin broke down, seoul chips breaking, tokyo chips through the floor · futures, new york chips breaking, vix breaking. The crack showed in Seoul hours before New York.
Old ceiling, new floor
Yields are settling here
What America pays to borrow for ten years came back to test its old ceiling. If it holds, the shock is digested. If it breaks, rates are falling because something else is breaking.
- Old ceiling, new floor
- Yields are settling here
The US 10-year Treasury yield daily from May 2023, drawn as a line of light. Sim's level at 4.805% (the October 2023 and January 2025 tops) is a gold zone from 4.75% to 4.85%. Yields broke above it in September 2026, peaked at 5.31% on 5 Oct 2026, and came back to 4.84% on 5 Nov 2026, testing it from above.
Bond fear broke its line
Now it stands on it
Bond fear broke the line that kept it calm all year and now stands on it. When bond fear finds a floor, everything priced off bonds feels it.
- Bond fear broke its line
- Now it stands on it
The ICE BofAML MOVE index of bond-market fear, daily from June 2024, drawn as a line of light. Sim's falling trendline runs from the April 2025 spike near 140 through the March 2026 spike, drawn as a gold zone. MOVE broke above it in October 2026 and has fallen back to rest on it at 97.92 on 5 Nov 2026.
The plumbing is calm
Above 0.10 is risk
The rate banks charge each other for overnight cash is not screaming. No undue stress, and we are one hair under the line.
- The plumbing is calm
- Above 0.10 is risk
The spread between SOFR and the effective Fed funds rate, daily from May 2025, in percentage points. The area above 0.10 is shaded as the risk zone; spikes poke into it in late 2025 and early January 2026. The latest reading is 0.06 on 4 Nov 2026, under the line.
Go deeper
The ten-year broke above its old ceiling at 4.805% in September and has come back to test it from above: 4.84% on 5 Nov. It is stabilising around that level. If it holds, the yield shock is digested. If it breaks, rates are falling because something else is breaking.
MOVE, the bond market's fear gauge, broke my falling line in October and has fallen back to rest on it: 97.92 (close, 5 Nov). It is finding support above that key level, which means the bond market's new fear regime is holding. When bond fear finds a floor, everything priced off bonds feels it.
SOFR minus Fed funds: the rate banks charge each other for overnight cash is not screaming. On 4 Nov the spread was 0.06, against the daily effective rate. As of now, no undue stress in the banking system. Anything above 0.10 is risk, and we are one hair under it and climbing. On 30 October I showed you this chart as stress, read against the monthly Fed funds average; against the daily rate it had calmed, and I'll say that as plainly as I said the warning.
Japan's bond market cracked first in Asia: its ten-year yield touched about 3.1% on 25 September, as reported, before the government promised to respond. Remember that when we get to Tokyo.
How far bonds went: the US ten-year pushed through its old ceiling to 5.31% on 5 Oct, and bond fear, the MOVE index, climbed to 114.
On the board
- US 10-yearTESTING
- MOVEBROKE UP
- SOFR − Fed fundsHOLDING
IVFear
Fear changes season
Fear has seasons, and we have walked into a stormy one.
Volatility is the price of fear. And fear has seasons. In a calm season it drifts lower, month after month. In a stormy season it jumps, and jumps again. We are in the middle of a high-volatility season. Bond fear, oil fear and Bitcoin fear have each broken the line that kept them calm for most of this year. In a season like this, volatility spikes are normal.
And on 5 November the stock market's fear gauge joined them. The VIX jumped from 16.61 to 28.18 (close, 5 Nov), +69.7%, the biggest one-day jump in over two years, straight up through its calm line. The next line on my chart is the one I drew at 29.27. My read: the signals say it could go much higher. A storm frightens the people caught out in it. For us, waiting in cash, it is the weather we were built for.
Fear slept under this line
Then fear woke up
The stock market's fear slept under its calm line for weeks. On 5 November it jumped from 16.61 to 28.18, straight up through it. Two closes above make it a new season.
- Fear slept under this line
- Then fear woke up
The CBOE Volatility Index (VIX), the stock market's fear gauge, daily from June 2025, drawn as a line of light. A gold zone from 19.50 to 22.50 marks the calm line, the level where fear has repeatedly climbed and stopped; it was drawn from the data, not from Sim's capture. The last complete close was 28.18 on 5 Nov 2026. The latest print is a dashed stretch ending in a ring, labelled with its date and New York time.
Fear has seasons
In storms, spikes are normal
5 November
calm seasonstormy season
How it worksStormy = closes above 20 around a spike past 25
In a stormy season, a spike like 5 November is normal: it is the weather. And stormy seasons last months, not days.
- Fear has seasons
- In storms, spikes are normal
- 5 November
The VIX, the stock market's fear gauge, since 2024, drawn as a fine needle of light on a slowly scrolling band of paper, with soft calm and stormy seasons behind it and a gold calm line from 19.5 to 22.5. The last complete close, 4 NOV, was 16.61. On 5 NOV the needle jumps to 28.36 at its intraday high and sits at 28.18 (close), with a gold bloom at the spike.
Fear has its own zones
The price of insurance
A broken line changes season
When fear breaks above its falling line and holds there, I read it as a change of season, not a passing storm.
- Fear has its own zones
- The price of insurance
- A broken line changes season
A schematic, not data. Low over a sea of light at blue hour, a fear line draws across the sky and slides down along a falling gold line, touching it three times from below while the sea lies glass-still. The line breaks up through and holds above it, the sea lifts into long swells and the ground cools to slate blue, a fresh swell brings a Stocks, 5 Nov chip, and a small still gold-rimmed basin glows calm at the near edge.
Oil's fear changed season
A long war, fought digitally
My read The zones and drawings here are mine.
My readA new volatility regime in oil tells me the next stage of the war is not a quick ending. My read: a year of bleed around Iran, fought more and more through AI cyberattacks on infrastructure.
- Oil's fear changed season
- A long war, fought digitally
The CBOE crude oil volatility index (OVX) daily from May 2024, drawn as a line of light. Sim's falling trendline from the March 2026 spike near 120 is drawn as a gold zone; OVX broke above it in October and holds above at 60.29 on 5 Nov 2026. The second line, a long war fought digitally, is labelled my read.
Crypto's calm season is over
Volatility is what we catch. Its season has started.
- Crypto's calm season is over
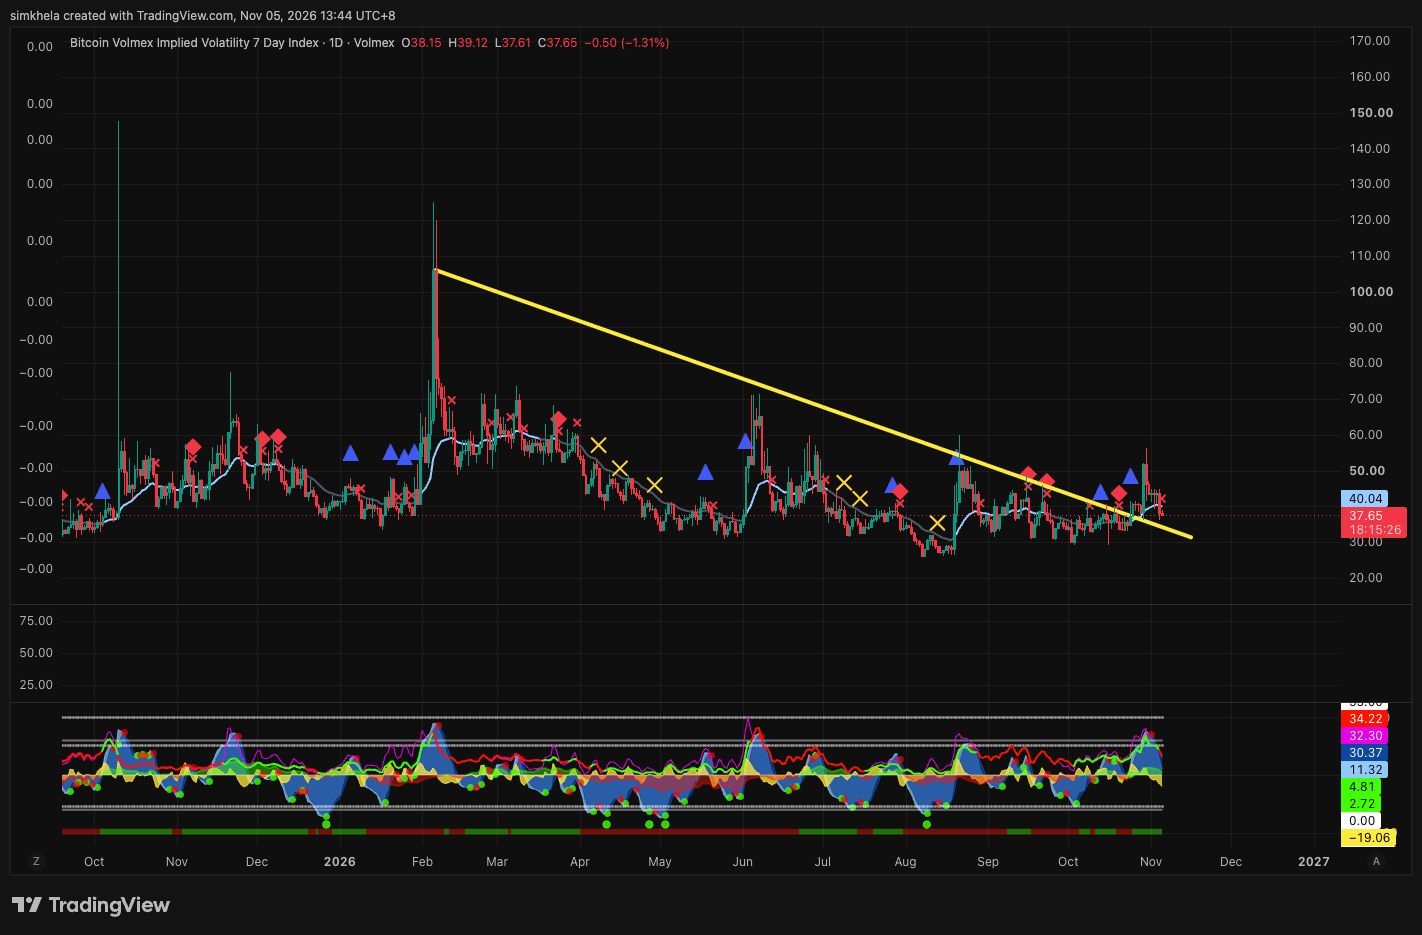
Sim's TradingView screen of the Bitcoin Volmex 7-day implied volatility index (BVIV 7D), September 2025 to 5 November 2026: his falling yellow trendline from the February 2026 spike is lit as a gold zone; the index broke above it in late October and is testing it from above at 37.65.
Go deeper
The VIX sat under its calm line, the zone from 19.5 to 22.5 where fear has climbed and stopped again and again, and closed at 16.61 on 4 November. On 5 November it was at 28.18 (close, 5 Nov). The rule on this page asks for two closes above the zone before a break counts, so until then it is breaking, not broken. Be honest about the clock: in stocks, this stormy season is days old; in bonds, oil and crypto it has run for weeks. My read: fear is waking up in stocks too, and seasons of fear last months, not days.
OVX, oil's fear gauge, broke its line in October and holds above it at 60.29 (close, 5 Nov). A new volatility regime has begun in oil. My read: it tells me the next stage of the war is not a quick ending. I think it is a year of bleed around Iran, fought more and more through mutating AI cyberattacks on infrastructure: ports, pipelines, grids, payments.
BVIV 7D, crypto's fear gauge, broke its line in late October and is testing it from above. A new volatility regime has begun in crypto too. Volatility is what we catch. Its season has started.
On the board
- VIXBREAKING · second close pending
- OVXBROKE UP
- BVIV 7DBROKE UP
VThe AI trade
The floor snaps
One sector pumped while another bled. On 5 November the fracture reached the chips.
Money doesn't leave the market all at once. It sloshes from pool to pool. The broad market was climbing back to its highs while tech was being hammered. Liquidity drains the pools one at a time: one sector pumps while another bleeds, and the water moves on. So watch which pool is filling, not the headline.
And then the drain reached the heart of it. The chip makers, the engine of the whole AI trade: SMH 447.73 (close, 5 Nov), −11.2% on the day, straight through my pivot zone of 490 to 510. This is the moment the floor snaps. The AI trade is breaking. And in my read, when the thing that carried everything fractures, the crack runs both ways: up into fear, and down into everything bought on the same story, from Seoul to New York to the smallest coins.
Liquidity is sloshing
One pool fills, one drains
For weeks the broad market filled while tech drained. Then the drain reached the chips. I watch which pool is filling, not the headline.
- Liquidity is sloshing
- One pool fills, one drains
Three glass vessels of light labelled broad market, tech and semis, standing on a dark green floor. The broad market vessel is nearly full and filling, tech has slipped a little, and semis is almost drained, a swirl at its floor and a thread of light running down into a small glowing chip beneath it. A faint arc shows where the light poured from semis over tech into the broad market, and a new thread of gold light curves back from the broad market toward semis.
Back to the August high
A double top forming
Here every company counts the same, so the giants can't carry it. Two pushes into the same high, the second weaker. It confirms only if price breaks the low between them.
- Back to the August high
- A double top forming
The S&P 500 equal-weight ETF (RSP) daily from June 2025, drawn as a line of light. The August 2026 high is a gold zone from 222.50 to 223.80; it closed inside it at 223.33 on 4 Nov 2026 and the latest print is 216.87 on 5 Nov 2026. A fainter band at 207 to 208, the early-October low, is the line that would confirm a double top. The NYSE Composite closed at 23,956, near its own August high.
Tech is losing its grip
The floor snaps
My read Do not set a buy at a number from this drawing. The panic sets the number. The system catches it.
My readTech's highs rose as its strength faded: a tired market. My read in my notes of 5 November was a bounce from the pivot. SMH fell through it to 447.73. Two closes below 490 break it.
- Tech is losing its grip
- The floor snaps
Two panels. Top: the Nasdaq-100 daily from February 2025, about 15% below its October high at 26,630, in a gold support zone from 28,000 to 28,500, with red diamonds along its rising highs and a previous cycle laid over it continuing to the right in gold dashes, drawn, not data. Bottom: the VanEck semiconductor ETF (SMH) daily from December 2023, about 33% below its peak at 447.73, against Sim's pivot zone of 490 to 510, with the next zone, 400 to 425, faint below. Each shows the latest print as a dashed stretch ending in a ring, labelled with its New York time.
The engine of the AI trade
Pressure on the chips
The floor snaps
The chip makers carried the whole AI trade. On 5 November they fell through the floor under them.
- The engine of the AI trade
- Pressure on the chips
- The floor snaps
A microchip made of old-gold light floats and slowly turns above a horizontal plane of light, the floor zone. Motes of light gather on the floor beneath it, pressing it down. Then a fine crack of light runs across the floor, the chip drops a little through it, and motes spill below the floor like a slow waterfall.
Go deeper
The equal weight S&P 500 pushed back into its August high, 222.50 to 223.80, and closed at 223.33 on 4 November, inside it; on 5 November it was at 216.87 (close, 5 Nov). The NYSE Composite is at 23,956, near its own high. Two pushes into the same zone, the second with less force: a double top forming. It confirms only if price breaks the low between them, at 207 to 208.
The Nasdaq-100 is about 15% off its October high at 26,630 (close, 5 Nov), −6.4% on 5 November. Its highs went up while its strength went down: that's a tired market.
The semiconductors are the fracture. SMH closed at 504.27 on 4 November, inside my pivot zone of 490 to 510. On 5 November: SMH 447.73 (close, 5 Nov), −11.2% on the day, straight through my pivot zone of 490 to 510, about 33% off its peak. The chip index fell about 11% and Nvidia about 7%, on fears of tighter rules for AI and data centres after the US midterms, not on earnings.
My read in my notes of 5 November was a bounce from this pivot as the liquidity sloshes around. It stays on the page, because I don't take back what I said; the zone rule now tests it. Two closes below 490 and the floor has broken, the bounce read is wrong, and the next zone on my chart is far below, at 400 to 425. Even if it bounces, my read is that bounces are part of the fall, not the end of it.
Why the chips matter for everything, in my read: they are the AI trade, the story that carried this market. When the thing that carried everything fractures, the crack runs both ways. Up into fear, the VIX. Down into everything bought on the same story: Seoul's and Tokyo's chip makers, then the risk assets that fall together, Bitcoin and the small coins among them.
Do not set a buy at a number from the drawings on these charts. The panic sets the number. The system catches it.
On the board
- NYSE CompositeHOLDING
- Equal weight (RSP)HOLDING
- Nasdaq-100BREAKING · second close pending
- Semis (SMH)BREAKING · second close pending
VIJapan and Asia
Japan goes through
Countries start to tumble. Japan went through its floor; Seoul and Jakarta sit on the edge.
Now look east, because this is where countries start to tumble. A country's stock market is more than a chart. It is pensions, savings, the confidence of a whole people. Japan broke.
Tokyo closed on 5 November a whisker above my floor. Then New York cracked overnight, and Japan went through the floor in the futures, the market that keeps trading while Tokyo sleeps. On 6 November Tokyo's own market went through it too.
China and India have been bouncing hard. Indonesia and Korea are fighting very critical levels, and in my read any breakdown from here would be calamitous. And see where the fracture showed first: Seoul fell as the world sold its AI chip makers in the Asian session of 5 November, hours before the same fracture reached New York. When I say the crack travels, this is what I mean. It doesn't stop at a border.
Countries start to tumble
Japan goes through
My read The zones and drawings here are mine.
My readAny breakdown in Jakarta, Seoul or Tokyo from here would be calamitous. Watch the closes, not the wicks. Japan went through its floor in the futures overnight: 57,060.
- Countries start to tumble
- Japan goes through
Five small charts from March 2026, each scaled so its gold zone sits at the same height: Hang Seng 23,920 (broke down); Nifty 50 23,961 (holding); Indonesia (IDX) 8.730 (testing); KOSPI 4,912 (breaking · first close pending); Nikkei 225 58,766 (breaking · first close pending). Hong Kong and India are dimmer, bouncing; Indonesia, Korea and Japan are lit, pressed on their zones.
Go deeper
The Hang Seng broke under its zone in October and, in the 5 November session, climbed back above it to 23,920: one close so far. The Nifty 50 held its floor twice, a double bottom, and is 9% above it at 23,961.
On 5 November Seoul fell 5.3% as investors sold AI chip makers (Samsung down 7.6%, SK Hynix down 9.4%), while Hong Kong rose about 3.7%. The same liquidity, leaving one pool and filling another on the same day.
Jakarta's ETF is on its line at 8.73, about 50% below its peak. KOSPI fell to 4,912 on 5 November, about 46% below its peak and just above the floor of its August crash. Watch the closes, not the wicks.
Why the futures: Tokyo's market was closed while New York fell, so the Nikkei futures, which trade around the clock, carried Japan's move. The Japan fund in New York, EWJ, was −6.0% on 5 November (close, 5 Nov). The cash index meets that price when Tokyo opens, and the two-close rule applies to the cash index.
Tokyo's cash market closed on 5 November at 62,189, a whisker above my floor of 60,000 to 60,800. Then New York cracked, and Japan went through the floor in the futures: the Nikkei futures at 57,060 (close, 5 Nov), under the zone. On 6 November Tokyo's own market was at 58,766 (intraday, 5 Nov 19:08 NY), through the floor.
On the board
- Hang SengBROKE DOWN
- Nifty 50HOLDING
- Indonesia (IDX)TESTING
- KOSPIBREAKING · first close pending
- Nikkei 225BREAKING · first close pending
VIIThe rupiah
The rupiah's last wall
The rupiah is defending its last wall, and families live behind it.
Now the currency of the archipelago. The rupiah is fighting desperately for this zone. Above it, the dollar has never cost more in rupiah. This line is not abstract. For every Indonesian family it is the price of the dollar in so much of what they buy.
For the third time the dollar is pressing against this wall, and each press spends the sellers waiting there. The momentum is turning down here, which gives the rupiah a chance. But a break would be felt in every price in the archipelago. So I watch this one with respect, not fear, and I think of the people it touches.
The rupiah's last wall
Third time pressed against it
The rupiah is fighting desperately for this zone. Above it, the dollar has never cost more in rupiah. A break would be felt in every price in the archipelago.
- The rupiah's last wall
- Third time pressed against it
The US dollar in Indonesian rupiah, daily from April 2025, drawn as a line of light. Sim's level at 18,126 (the June and July 2026 highs) is a gold zone from 18,100 to 18,200. The dollar is pressing it for the third time: 18,114 on 2 Nov 2026.
Go deeper
The rupiah is fighting desperately for this zone. Above it, the dollar has never cost more in rupiah: the June and July highs sit at 18,100 to 18,200, and the dollar was at 18,114 (close, 2 Nov), pressed against it for the third time. The momentum is turning down here, which gives it a chance. A break would be felt in every price in the archipelago.
On the board
- USD/IDRTESTING
VIIIOil and gold
Oil resets, gold is spent
Two markets tell you about the war, if you know how to listen.
Oil is the cost of moving the world: every ship, every harvest, every flight home. Oil's future has reset to a new, higher floor. Next year's oil fell hard and still landed above where it lived for years. That is a new pricing regime. This could be a local top. I don't think so. My call stands: above $150 by year end.
And gold. Gold is what people hold when they trust nothing else, the safest asset in the world. It has broken below its rising line and is fighting it from below. When the safest thing on earth can't get back above its floor, it's a huge sign that somebody out there is spending gold. My read: to pay for the war. And the bill for a war finds its way to every kitchen table.
Next year's oil got repriced
Seventy-four is the new floor
My read The zones and drawings here are mine.
My readThis could be a local top. I don't think so. A new pricing regime for oil, and my call stands: above $150 by year end. Latest: $91.10.
- Next year's oil got repriced
- Seventy-four is the new floor
Two lines of light from May 2024: WTI's front-month future and, thinner, the December 2027 contract. A faint band marks where the far contract lived from 2023 to 2025, about $57 to $69. Both fell in early November; the far contract landed in its gold zone of $73.50 to $75 (Sim's level $74.12) at 74.52, and the front month sits in its zone of $86 to $89 at 91.10, under the $116.91 ceiling of March and April 2026.
Gold is knocking from below
Someone is spending gold
My read The zones and drawings here are mine.
My readWhen the safest asset in the world breaks its floor and can't get back above it, somebody out there is selling gold to pay for something. My read: the war.
- Gold is knocking from below
- Someone is spending gold
Gold (the COMEX front-month future) daily from June 2025, drawn as a line of light. Sim's rising trendline from the August 2025 base is drawn as a gold zone about 70 dollars wide; a yellow X marks the late-October break below it; a second band marks the July lows near 3,880 to 3,950. The latest print, 4,106 on 5 Nov 2026, pushes up into the old floor from below. The second line is labelled my read.
Go deeper
Oil. On 4 November oil fell about 8% in a day, WTI to $88.12 at the settle, on hopes of less escalation around Iran after the US midterms. The front month was $91.10 (close, 5 Nov). The contract for December 2027, the market's settled belief about next year, fell with it and landed on its new floor at $74.52 (close, 5 Nov), about $5 to $17 above where it lived from 2023 to 2025. A sharp drop that stabilises at a new level says this is a new pricing regime for oil. This could be a local top. I don't think so. My call stands: above $150 by year end. Latest, $91.10 (close, 5 Nov).
Gold broke below my rising trendline in late October, right where a yellow X printed, fell toward its July lows, and is now pushing back up into the old floor from below: 4,106 (close, 5 Nov; the COMEX future; my chart is spot). When the safest asset in the world breaks its floor and can't get back above it, it's a huge sign that somebody out there is selling gold to pay for something. My read: the war.
On the board
- WTITESTING
- Oil, Dec 2027TESTING
- GoldBROKE DOWN
IXCrypto
The floors and the fractal
Every important crypto floor is being tested at once, and risk falls together.
Bitcoin is fighting for eighty thousand: 76,111 (intraday, 5 Nov 19:20 NY), under its zone. Eighty thousand is a story everyone can tell, so the crowd gathers there. My read is a range between seventy-five and eighty thousand until some major news takes it lower, the way the fractal has drawn it.
And when the AI trade fractures, risk falls together. In a real panic people sell what they can, not what they want, so in my read the fracture in the chips runs straight into Bitcoin and the small coins. For those of us waiting in cash, that is not a reason to be afraid. A panic is the moment prices finally tell the truth, and the panic, not our nerves, sets the price we catch.
Fighting for eighty thousand
The fractal still points down
My read Do not set a buy at a number from this drawing. The panic sets the number. The system catches it.
My readMy read is a range between seventy-five and eighty thousand until some major news takes it lower, the way the fractal has drawn it.
- Fighting for eighty thousand
- The fractal still points down
Bitcoin on Bitstamp daily from April 2024, drawn as a line of light. The 80,000 zone, 79,500 to 80,500, is gold; the latest print is 76,111 on 6 Nov 2026. To the right, Sim's range of 75,000 to 80,000 and the previous cycle laid over this one continue in gold dashes, drawn, not data, with no price labels.
Clinging to its line
My read: it breaks down
My read The zones and drawings here are mine.
My readWhen this line goes, it goes violently, and my read is down. MSCI's list is due on 11 November.
- Clinging to its line
- My read: it breaks down
Strategy (MSTR) daily from March 2025, drawn as a line of light. Sim's long rising trendline is a gold zone about 138 to 144 now; last week's wick dipped under it, and the latest print is 129.30 on 5 Nov 2026, under the line. A marker shows MSCI's 11 November date. The second line is labelled my read.
Five touches. Worn thin
The sixth should break
My read The zones and drawings here are mine.
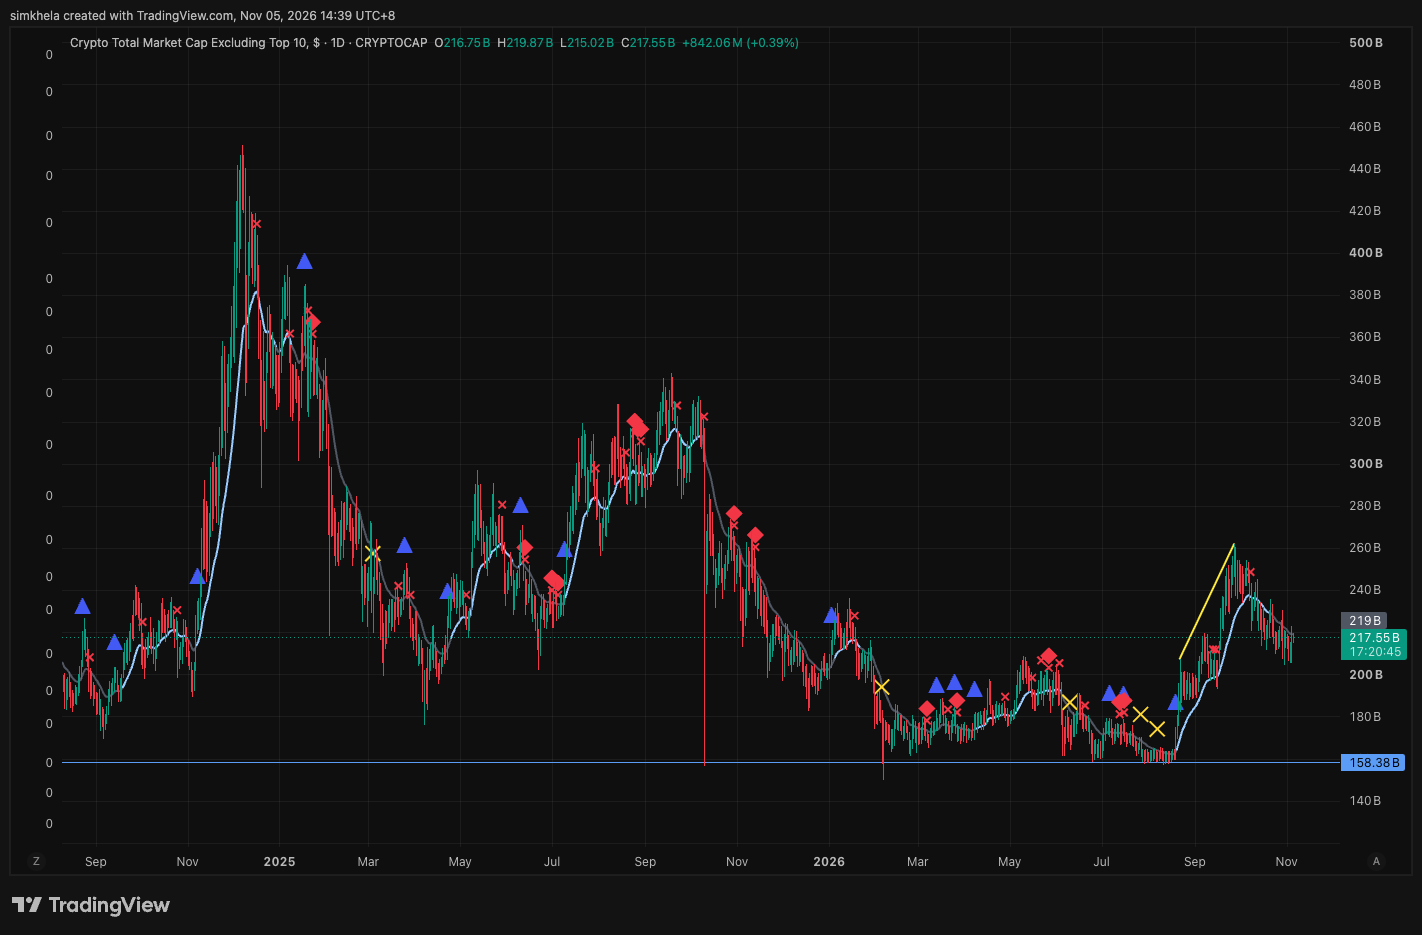
My readThe small coins together have hammered the same floor five times in a year. Each touch spends it. On the next hit, my read is that it breaks through.
- Five touches. Worn thin
- The sixth should break
Sim's TradingView screen of CRYPTOCAP:OTHERS, total crypto market value excluding the ten largest coins, August 2024 to 5 November 2026: his floor at 158.38B lit as a gold zone, with five touches blooming in turn, each fainter: the 10 October 2025 liquidation wick, February, March to April, July and late August 2026. Latest 217.55B. The second line is my read.
Four coins, one shape
Compression ends in a move
Each high is lower, while buyers defend the same floor. Compression resolves violently, and more often down. Where the lines meet is a drawing, never a target.
- Four coins, one shape
- Compression ends in a move
Four small charts, each with Sim's falling trendline and a flat floor drawn as gold zones, pressing together into a triangle: Gram (TON) 1.104; Sui 0.850; Dogecoin 0.0717; HBAR mkt cap 3.0B. Prices from CoinMarketCap; HBAR is market capitalisation.
Altcoins turn first
My read: early 2027
My readThe small coins tend to fall first and turn first, and my read is that their bottom comes at the start of 2027.
- Altcoins turn first
- My read: early 2027
A deep green ground with a faint time line marked only now at the left. A cloud of turquoise motes has fallen ahead of a dim, larger body of light, the bigger coins, and curls upward along a smooth gold dashed path tagged drawn, not data. Beneath the curl a small warm first light glows on the ground inside a broad soft band labelled Sim's read, the start of 2027, and a glass card at upper right, tagged my read, says early 2027.
The ripples are still spreading
Next: the machines' panic
We never ask for keys
Hold on to the quiet
My readThe hack was one stone in the pond, and the ripples are still spreading. My read: next come AI cyberattacks that start to panic crypto people.
- The ripples are still spreading
- Next: the machines' panic
- We never ask for keys
- Hold on to the quiet
A glass basin of turquoise light on a deep green ground, seen at an angle, its gold rim one complete lit ring. A small gold-rimmed basin glows near its centre, your own account. Every ring has stopped: the water is a mirror holding the five slim gold zones doubled in its surface, a faint lattice of structure lines across it and a cold ice stone resting dim at the right. The view tilts down to a grazing angle so the far rim becomes a single horizontal gold line, a faint warm lift at its centre. The words read: Hold on to the quiet.
Go deeper
Strategy has been struggling to stay above its long rising line; the latest print is 129.30 (close, 5 Nov). Eventually it should break, and when this line goes, it goes violently. My read is down. MSCI's list is due on 11 November.
OTHERS, the small coins together, has hammered the same floor five times in a year: the 10 October 2025 liquidation wick, February, March to April, July and late August. Each touch spends the zone. On the next hit, my read is that it breaks through.
TON, SUI, DOGE and HBAR are all compressing into the same shape, a descending triangle: lower highs pressing onto a flat floor. Compression resolves violently, and more often down. The apexes are drawings, never targets. Altcoins tend to turn around early, and I wouldn't be surprised to see their bottom at the start of 2027. That's my read.
The ripples of the hack will propagate for some time yet and lead to further downside. And at some point now I expect AI cyberattacks to start panicking crypto people. When they do, remember this page: the panic is what we were built to catch.
Nobody from XLNC will contact you about this. We never ask for keys. Your money never leaves your own exchange account, and we cannot withdraw it.
On the board
- BitcoinBROKE DOWN
- StrategyBROKE DOWN
- OTHERSHOLDING
- TON · SUI · DOGE · HBARTESTING
XThe clock
How long a snap takes
My read: weeks and months, then 2027.
So how long? My read. Breaks like this take time to propagate. The fast money moves in hours, the slow money over weeks and at the month end, and prices bounce along the way. In my opinion it could take until the end of the year for things to tumble properly.
And I've watched one pattern again and again: the market tends to hold up just long enough for the big money to be raised. My read: this could all be the process of raising capital before the Anthropic IPO, and after it the real tumble of the whole sector begins, in 2027.
The Bitcoin, S&P 500 and Nasdaq fractals and the whole framework all say the same thing to me. My read: by the beginning of 2027 we should take a significant tumble, and this is the beginning of that crashing process, with bounces along the way. We don't need the date. The panic will tell us when.
The clock · Sim's read
How long a snap takes
The tumble builds through year end
Then the IPO window
2027
My readMy read: the breaks spread over weeks, the tumble builds through year end, markets hold up for the Anthropic IPO to raise its money, then the sector's real tumble begins in 2027.
- How long a snap takes
- The tumble builds through year end
- Then the IPO window
- 2027
A luminous road winds from the foreground, marked 5 November, the floor snaps, toward a horizon. Beside it, each tagged as Sim's read: weeks of propagation, year end where the tumble builds, the IPO window as a gate of old-gold light where markets hold up long enough for the Anthropic IPO to raise its money, and 2027 where the sector's real tumble begins. Past 2027 the road continues into a faint first light, and an hourglass of gold light stands at the horizon.
Go deeper
What is reported, not my read: Anthropic filed its registration statement publicly on 26 October to list on the Nasdaq under the ticker ANT, with Goldman Sachs and Morgan Stanley first among its underwriters. Bloomberg reported that the roadshow could begin the week of 9 November, with a debut targeted before Thanksgiving. The company has not set a price or a date.
A read on timing is a map, not a date to act on. We don't act on dates. The panic sets the price, and the system catches it.
Fractals are previous cycles laid over this one to compare their shapes. They are drawings, not forecasts, and never a price to buy at.
The close
Zones tell you where, panic tells you when
Systems are snapping. In my read we are headed toward the major snap, and that is where we catch the fall.
Here is the map
Zones tell you where
Panic tells you when
Zones tell me where. Panic tells me when.
- Here is the map
- Zones tell you where
- Panic tells you when
A hillside map of seven stepped terraces of gold light on ivory marble with soft sage washes, stepping down from the upper left to the middle, each a little shorter. On the lowest, at about two thirds of the height, a katana of polished gold light rests in a still pool of ivory light, with empty marble to its right. At the top right a row of small pearls, one per market on the board, lit gold up to the count, with the count small beside it, and a glass tag, Sim's read. The count reads 18 of 23 markets broken or testing a critical zone, as of 5 November 2026. The words read: Panic tells you when.
So here is the map. Bonds broke first. Fear changed season in bonds, oil and crypto. The hack was a fracture. On 5 November the floor began to snap under the AI trade: the chip makers fell through my pivot zone, the stock market's fear gauge jumped through its calm line, and Japan went through its floor. Countries are starting to tumble and systems are starting to snap. The plumbing is still calm, one hair under risk. Oil's future is repriced, gold is being spent, and the rupiah, Seoul and Jakarta are pressed against their walls. Every important crypto floor is being tested at once. 18 of 23 markets on my board are broken, testing or breaking a critical zone. Some have already broken, and my read is that with patience the rest will break hard.
Now the part that matters most. We don't need to guess which goes first. In my read we are headed toward the major snap, and that is the moment we catch the fall. We've been in cash for 379 days. We watch the zones, and the system catches the panic, not our nerves. How long, my read: moments like this rarely resolve in a day. The tumble plays out over weeks and months, with bounces along the way. It could take until the end of the year for things to tumble properly, the market may hold up just long enough for the Anthropic IPO to raise its money, and by the beginning of 2027 the real tumble begins. So patience, again. The panic sets the price, not the first red day.
What I'd want you to do now
This is how you end up on the right side of what's coming: one of the people it serves, not one of the people it hurts. Educational, not personal advice; this is what I do, and what I'd tell my own family. I run Crypto XLNC, a service, so I have an interest in this subject; this page is education.
- 01
Stay calm in cash.
Cash is a position, not a waiting room, and on a day like this it is the calmest seat in the room. I don't spend mine on bounces or on fear. The wait is ending, on the market's clock, not ours.
- 02
Don't mistake the first red day for the panic.
A floor snapping is the start of the story, not the end of it. My read is that the tumble plays out over weeks and months, with bounces that feel like the bottom and aren't. The panic sets the price, not the first red day and not the headline.
- 03
Watch the closes, not the wicks.
A wick through a zone is a test; two closes beyond it is a break. Ask the four questions of any chart: where is the zone, how big is it, who waits behind it, has it broken or is it being tested?
- 04
Lock every door.
Two-factor on, a withdrawal whitelist on your exchange, keys shared with no one. Nobody from XLNC will contact you about this, the hack or a "recovery". We never ask for keys. Your money never leaves your own exchange account. Anyone who asks for your keys is the next hack.
- 05
Write down your prices.
The prices that live in your memory: the one you missed, the one you sold at, the one you're waiting for. Seen on paper, they stop deciding for you.
- 06
Decide now how you'll catch it.
While it is calm, decide how you will act when the panic comes: by hand on your nerves, or with a system that waits in cash and catches it for you. That is what we built Crypto XLNC to do, and how it works is linked below. No pressure, and never a promise of returns.
- 07
Write one sentence for the worst day.
Write it today and read it on the worst day. Fear is loud and structure is quiet; give your future self the quiet in your own handwriting.
- 08
Look after the wealth that isn't money.
Sleep, your body, your family, your friends. A calm nervous system is the best risk manager ever built, and the one that compounds forever.
The dawn is part of the night
With love and light
The night is real, and so is the morning.
- The dawn is part of the night
- With love and light
Sunrise on an ocean of light. A figure of golden light, seen three-quarters from behind, stands in a still pool of ivory light on the calm water and faces a soft low sun whose upper edge has just cleared the horizon, a fine line of liquid gold at the cold open's floor height, with a path of glitter running over the water toward the figure. The sky is ivory marble with gold veins and soft sage washes. Three slow gold rings have spread from the figure's feet, and small warm lights rest on the water near them. The words read: With love and light.
The dawn is part of the night
Everything on this page is the old system doing what old systems do at the end of a cycle: stretching, testing its walls, and finally letting go. It looks like breaking. It is also a transfer. Value is moving, slowly and then all at once, from a world built on fear and extraction to one built on consciousness and abundance, and every panic is a door in that passage.
We are not here to fear the storm. We are here to be calm inside it, to catch what it hands us, and to carry that value into the world that's coming: more conscious, more connected, more abundant for more people than any time before it. A conscious, infinite world. Harmony between people, nature and spirit isn't a dream at the end of this road. It is the road.
So hold your cash with patience, hold your family close, and hold your heart open. The night is real, and so is the morning. I'll see you on the other side of the panic.
With love and light, Sim.